
This article will walk through the setup of the Power BI Desktop report for accessing 1Stream call data
Using Power BI Premium with Capacity or Fabric with Capacity?
You can refresh this data programmatically and have the data viewable in an online central location. Follow our guide Power BI Premium and Fabric with Capacity Integration for more on that.
1Stream Level Feature Notice
This feature is available for only Core level 1Stream users and up. If you would like this feature to be available, then please reach out to your bvoip Sales Representative to upgrade user licensing.
Microsoft Licensing Required
In addition to 1Stream, you must have a minimum of Power BI Pro through Microsoft 365. This license comes with Microsoft 365 E5 if you already have that.
Why Power BI?
Many Microsoft 365 partners now have access to Power BI Pro via the Microsoft 365 E5 licensing included in their partnership competency. Even if you don't currently have a license, Power BI Pro is a lower cost option for data analytics compared to many other platforms.
What does this template do?
All of the data in this template can be found in various forms inside the 1Stream console, but this template will allow you to pull that data down where you can then visualize and adjust the data to best fit your needs.
We see this template as a starting point, and we hope it helps your team build out additional visualizations to better serve your specific needs.
Download the Template
- In the 1Stream portal go to Administration > Downloads
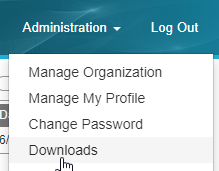
- Click Download Power BI Pro/Premium Report
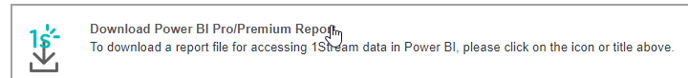
- That will then download bvoip 1Stream.PBIT.
Load the Data
- If you have not done so already, please Generate an API Key which will enable you to access the API to pull data.
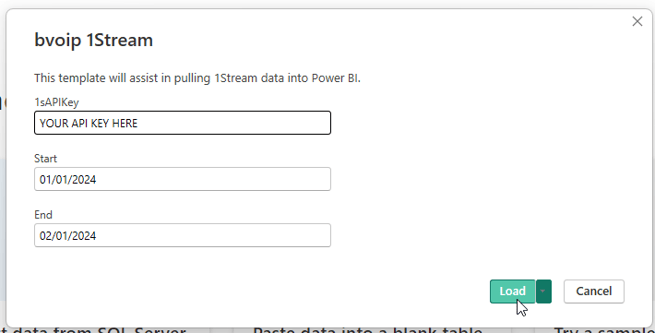
- Open the bvoip 1Stream.PBIT template in Power BI.
- Enter in your API key, as well as a start and end date, and click Load.
- Wait a few minutes for the connections to complete and the data to be ingested. This will take longer the more dates you have selected.
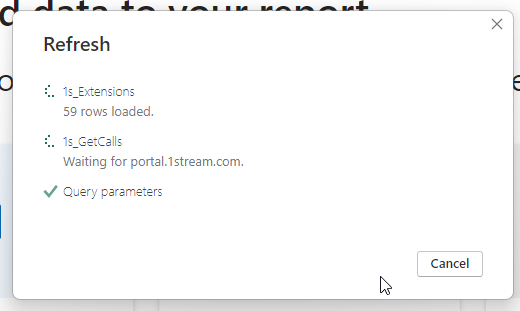
- Once the data collection is complete, the report data will populate.
Leveraging the Data
The template comes with 4 pages for you to start with:
- Dashboard: This shows your extensions, queues, and their current statuses. This is more so a fit for the Power BI Capacity plan, where it can update more frequently than 8x a day.
- Call Data: The bulk of the report, you can click on various visuals to filter the data. We highly recommend you play around with additional visuals.
- Call Flow Breakdown: A very rough map showing how your calls are flowing. This is read as "Source > Destination" but do note any extensions above 9999 are just the trunk.
- Built-In AI: Power BI has a built-in Q&A system, where it leverages "AI" to take your question and turn it into a visual. This is there so you can see how that works, and maybe get ideas on additional visuals.
Lastly, below are some tips on how to best leverage the data as presented.
- Click on any of the visual slices (colorful part of visuals) and it will filter the page. You can also CTRL + Click to select multiple filters and further drill down into the data.
- If you're looking to ensure the fresh button always pulls all data, you can set the start and end dates to far out in the past and future. 01/01/2000 through 01/01/3000 is guaranteed to always return all your calls, but it may take a LONG time to refresh.
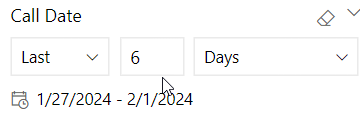
- After downloading many months of data, you can further filter the Call Data page in the top left using the Call Date splicer.
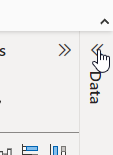
- You can expand the Data menu on the far right to see all available fields
- Have any additional ideas we should add to the template? Make a new item in our Enhancements & Ideas portal and we'll see if we can accommodate that.